

[ WAA Home | ProjeX Home | Download ProjeX | Help using ProjeX | ProjeX FAQ | About WAA]
Example - Producing a simple ProjeX sheet & Gantt chart
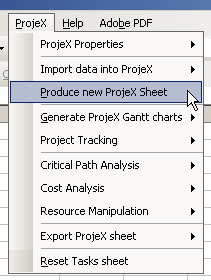
ProjeX requires the Excel worksheet to be set up in a particular way to generate Gantt charts so the first thing to do is produce a new ProjeX sheet using the option on the menubar.
ProjeX overwrites the current sheet with its own format data, the warning dialog below appears. For this simple example we are going to let everything default.
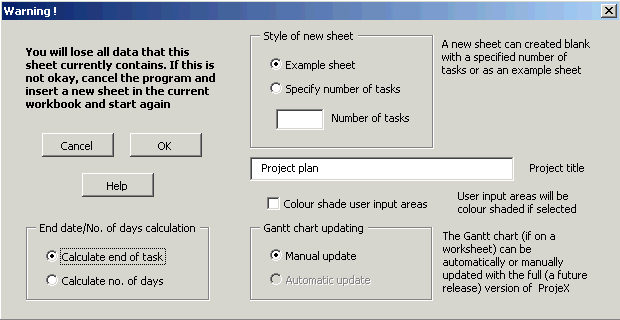
This means that the ProjeX sheet generated will have a heading, short list of tasks and a couple of milestones to show the user the format and style of a typical project. All the tasks will be defined by a starting date and a duration (in days). If we wanted them to be defined by a starting date and an ending date then we would click the option to calculate the number of days in the bottom left of this dialog. We can, at a later time, change individual tasks so they are defined differently.
When we OK our selection the 'Display Properties' dialog appears.
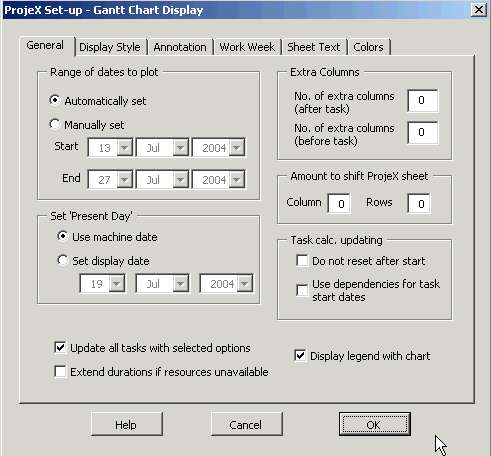
This dialog is where the user sets the way the Gantt chart is plotted (eg. whether the time axis is daily, weekly or monthly), the range of dates plotted, colors, adding columns and a number of other functions. The dialog can be brought up at any time from the main menubar. Again for this simple example lets default everything.
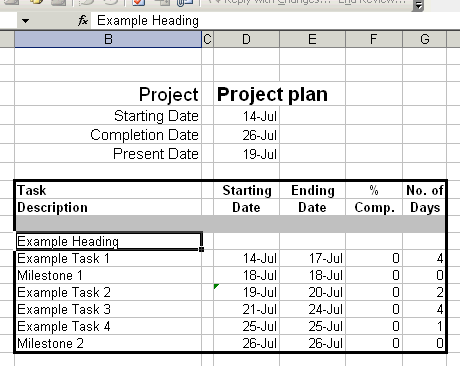
In ProjeX a heading is defined by a task that does not have a starting date. A milestone is defined as something that has a starting date but no duration and a task as something that has a starting date and a duration (or an ending date if we are using start and end).
![]()