

[ WAA Home | ProjeX Home | Download ProjeX | Help using ProjeX | ProjeX FAQ | About WAA]
Gantt charts with Fiscal time axis
The monthly axis for Gantt charts is useful to display large project that run over several years. Another display axis is fiscal quarters. The user specifies the month to start the first quarter of the year and all dates are then plotted based on the fiscal quarter they fall into. In the Gantt chart below (example 1), the 'start of year' was defined as April, this means that the planning stage of Project 1 falls in Q4 of the year before because Q4 is defined as Jan-March .
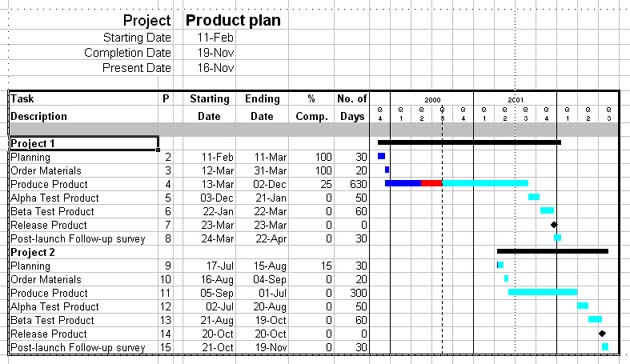
Example 1 - Fiscal plot, Q1 starting April 1st
Example 2 shows the same ProjeX sheet but with the start of Q1 defined as August 1st. This means that February now falls in Q3
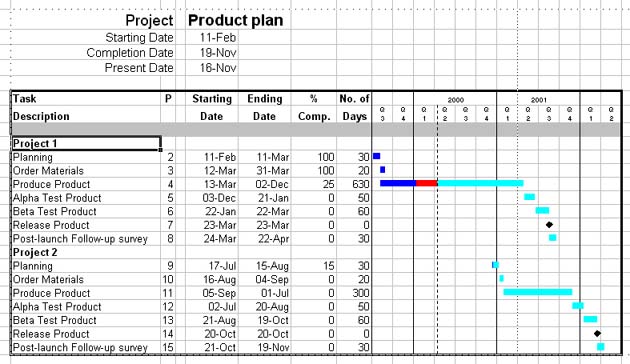
Example2 - Fiscal plot, Q1 starting August 1st
If you want to see what this chart looks like with the monthly axis click here.