
[ WAA Home | ProjeX Home | Download ProjeX | Help using ProjeX | ProjeX FAQ | About WAA]
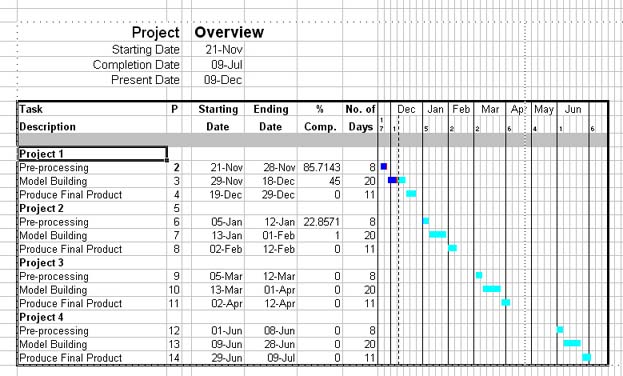
Gantt charts with Weekly time axis
The weekly axis for Gantt charts is useful to display large project that run over more than about 250 days.
When plotting using the daily axis, ProjeX uses one Excel sheet column for each day. Excel has a limitation of about 256 columns per sheet so if ProjeX detects that the chart will 'run off the end of the sheet' it changes the axis to the next time scale.