[ WAA Home | ProjeX Home | Download ProjeX | Help using ProjeX | ProjeX FAQ | About WAA]
Cost Analysis tables and plotting
Having allocated resources to a project we can produce plots of resource usage. These plots are generated and saved in the Resources workbook.

On selecting this option a dialog appears with a number of options split into two tabs
Calculating the cost accrued by a resource for a task is complicated by the fact that the task might not have as many hours available on a given day as the resource. We might have allocated 10 hours of the resource to a task but the task might only have 5 hours that day to work. For this case the 5 hours will be accrued that day and the 5 other hours spread over the other days of the task.
Task Parameters

the total cost and accrued cost to date can be displayed on the Gantt chart (if the 'Display cost on Gantt' option is checked).

- Resources to plot - the user can either select a single resource to plot or plot all of them from the Resources workbook. If the 'Check Resources' option is selected then each task allocated to a given resource is checked (in the ProjeX sheet) to see if the start/end dates have changed.
- Date range to plot - the user can specify the date range to analyze or ProjeX will plot the date range for which the resource is 'working'.
- Plot axis - the chart can be produced with the axis as days, weeks or months.
Plotting Parameters

- Main plot parameters - Controls whether the axis are annotated and a legend plotted
- Data table parameters - The data table (date and cumulative cost of task allocated in that time period) can be displayed at the bottom of the chart. This information is generated in a separate sheet.
- Plot style - controls the plot style of the cost analysis.
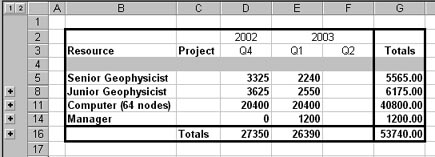
We can also generate a table for all the projects allocated in the resource file showing the cost breakdown.

This option is available under both the Cost Analysis and Resource Manipulation menus to generate:

The table is grouped to make it easy to just display the overview of the resource costs.


