[ WAA Home | ProjeX Home | Download ProjeX | Help using ProjeX | ProjeX FAQ | About WAA]
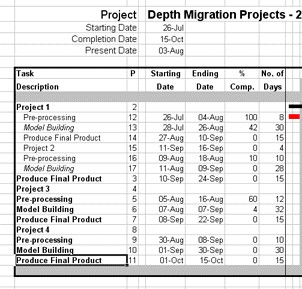
Having repeated the right mouse but option to select the tasks ranges from each of the projects for each of the overview tasks we get:

Before we generate a Gantt chart, ProjeX currently thinks the group title 'Project 2' (in row 15) is a task because we overwrote an existing ProjeX sheet. Let's delete all the task info. (start and end dates, etc) and also using the right mouse button and the 'Task Definition' option set it as an overview group.
We can now generate a Gantt chart (the plot below is with the weekly time axis).

At the same time the group of tasks are 'grouped'
together in the Excel sense (a little ![]() icon appears
on the left of the sheet) allowing the group to easily be
compressed to just show the group heading and the overall extent
of the group. Note the grouping occurs automatically in this case because we
used a workbook that had a ProjeX sheet already grouped as our starting point
icon appears
on the left of the sheet) allowing the group to easily be
compressed to just show the group heading and the overall extent
of the group. Note the grouping occurs automatically in this case because we
used a workbook that had a ProjeX sheet already grouped as our starting point
The group can be expanded back out by clicking on the ![]() icon on the
left of the sheet.
icon on the
left of the sheet.
The color used for this bar is the same as that specified for the milestone. This option is not available in the freeware version of ProjeX.
