[ WAA Home | ProjeX Home | Download ProjeX | Help using ProjeX | ProjeX FAQ | About WAA]
To analyze the usage of the resources we have been allocating to our projects while one of the project workbooks is open select the 'Generate Resource plot' option from the Resources menu

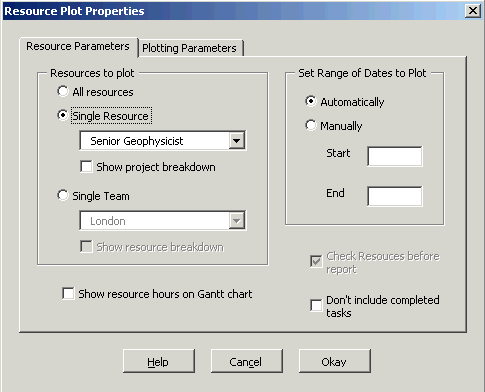
This brings up the dialog where we can select what resources to plot and how we want the plots displayed. All options selected relate to the resource file allocated to the project.

When we generate the plot(s) two new sheets are generated in the Resources workbook. The first shows the allocation of the resources for the date range to be plotted in a table format for each resource (if only plotting a single resource a breakdown for each project can be produced), the other sheet is a plot of the resource(s) using the generated table.
Lets just go through the options for the resource parameters tab of the plot dialog.
Resources to plot : A combined table for all the resources in the file can be produced as an Excel 3D plot or a single resource from the file can be analyzed (with the option to break out data on a per project basis). There is also now the option to plot a specific team. This requires that, when we defined the resources, we allocated them to teams. For example we might have a number of groups working on depth imaging projects or or computer resources might be housed in a number of locations.
We have the option to not include completed tasks in the resource plot.
The total number of hours allocated to a task can be displayed on the ProjeX sheet.
Having selected the resource(s) or team to generate the report for (and the plotting parameters) we can generate the report.
When generating the plot, Excel may ask if you want to update this workbook with changes made by others, click NO.
