
[ WAA Home | ProjeX Home | Download ProjeX | Help using ProjeX | ProjeX FAQ | About WAA]
Plotting Resource usage
Having allocated resources to a project we can produce plots of resource usage. These plots are generated and saved in the Resources workbook.
On selecting this option a dialog appears with a number of options split into two tabs
- Resource parameters
- Plotting parameters
Resource Parameters
- Resources to plot - the user can either select a single resource to plot or plot all of them from the Resources workbook. When just plotting a single resource a breakdown of the resource on a project by project basis can be produced. If resources have been allocated to teams we can also select the team to plot. The plot (and resource table) will give a breakdown of each resource in the team
- Date range to plot - the user can specify the date range to analyze (by default the entire time period of the resource or resources) or ProjeX will plot the date range for which the resource is 'working'.
Tasks that are completed can be excluded from the calculation/plot and we can also annotate on the ProjeX sheet the total hours allocated to each task.
Plotting Parameters
- Main plot parameters - Controls whether the axis are annotated and a legend plotted
- Data table parameters - The data table (date and percentage of resource allocated in that time period) can be displayed at the bottom of the chart. This information is generated in a separate sheet.
- Units of Resource Axis - The total amount of the resource allocated can be plotted/displayed as a percentage of the resource per day allocated or as the amount of hours per day allocated.
- Plot style - controls the plot style of the resource allocation (see below).
- Plot axis - the chart can be produced with the axis as days, weeks or months.
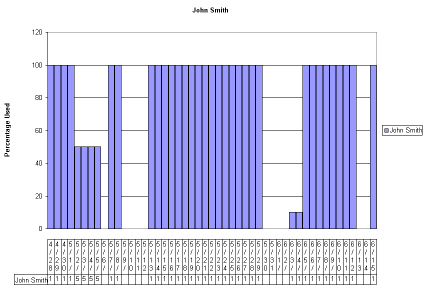
Single resource as histogram
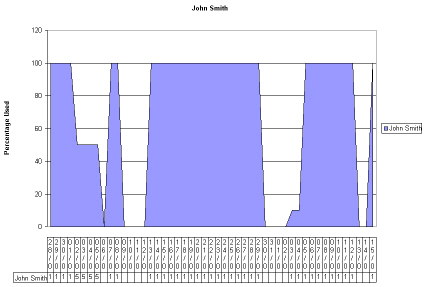
Single resource as a 2D area
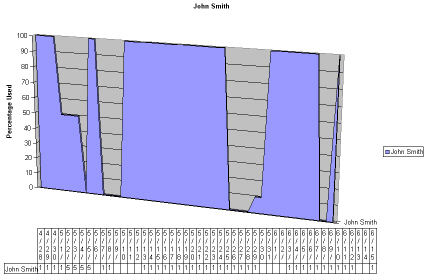
Single resource as a 3D area