
[ WAA Home | ProjeX Home | Download ProjeX | Help using ProjeX | ProjeX FAQ | About WAA]
Importing data into ProjeX from another Excel worksheet
ProjeX can import data from a standard Excel worksheet, generating a new ProjeX format sheet with the tasks arranged so a Gantt chart can be generated.
With the Excel sheet to be imported active, select the above menu option. This brings up the following dialog:
The user needs to define the name for the ProjeX worksheet and the various columns that the required data is in. Perhaps the first parameter that should be set is the number of rows in the Excel sheet to be skipped before the row containing the first task or group.
| Option | Description |
|
When the task information is read from the current Excel sheet, it is reformatted and out put to another Excel sheet ready for ProjeX to plot the Gantt chart. The user must supply a name for the ProjeX sheet. If it already exists, the old sheet will be deleted. |
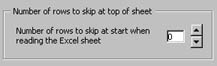 |
By default no rows at the start of the Excel sheet are skipped, by clicking on the spin bar (the two small arrows), the user can select the number of rows to skip at the start (for example there might be a title row). |
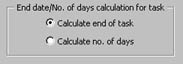 |
The user can set whether the tasks are defined (in ProjeX) by starting date and duration or by start and end dates. |
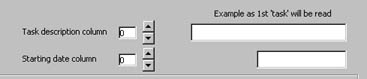 |
Tasks must have a column number set to locate the task description and also the starting date. By clicking the spin bar the columns to be read can be selected. The text boxes to the right will show the values of the first line to be read. |
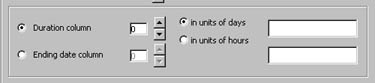 |
To define a task ProjeX needs either the duration or the ending date to be set. For durations the user must specify whether the units are days or hours. |
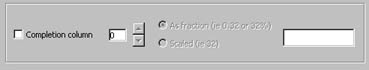 |
The percentage completion column is optional. The values can be specified as fractions (i.e. between 0 and 1.0) or 'scaled' (i.e. between 0 and 100). ProjeX will convert the numbers to 0 - 100 if required. |
| Extra columns of data can also be read in - the user is prompted for each to specify the column to import. |
A completed dialog will look something like:
The ProjeX sheet and Gantt chart is then automatically generated (in this example we have requested the resources to be read in as an extra column, when prompted '2' was entered as the column containing the extra data.