

[ WAA Home | ProjeX Home | Download ProjeX | Help using ProjeX | ProjeX FAQ | About WAA]
Network Analysis (Critical analysis and PERT charts)
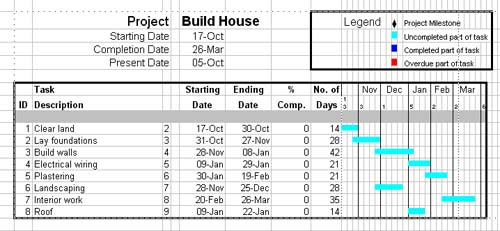
Gantt charts (see ProjeX) are good visual aids to planning a project, easy to understand and update as a project develops.
Project networks are not so easy to pick up and immediately understand with critical paths, dummy activities, nodes and crashing, many project planners tend to avoid them.
Network diagrams also do not clearly show a time line for a project but do show the tasks in their logical order.
There also seems to be a fair amount of confusion about what should be called what (and why) with a number of hybrid schemes creeping in. The next few pages may clarify or confuse, either way if you do not give us your opinion they will not change!
Why use networks?
Critical path networks highlight which tasks are critical for a project to stay on schedule and which can slide without affecting the completion date of the project. This allows tasks to be prioritized.
So we want to:
1. Locate the critical activities.
2. Allocate timing to the 'non-critical' activities to maximize the use of our resources.
3. Find ways to reduce the total project time while providing tools to monitoring the critical tasks so project slippage can be avoided (or at least recognized and acted upon).
Lets consider the basic networks that will be covered here:
· Arrow networks (or activity on arrow systems)
§ Critical Path Method (CPM)
§ Critical Path Analysis (CPA)
§ Critical Path Scheduling (CPS)
§ Program Evaluation and Review Technique (PERT)
· Activity networks (or activity on node systems)
§ Precedence diagrams (PDM)
§ Some other approaches that seem to have largely gone out of fashion - if you feel they should be mentioned email us.
Historically the arrow network has been used but not only is it difficult to make the transition from Gantt charts but also they can be difficult for computers to handle and manipulate.
Activity networks (and in particular precedence maps) are easier to handle by both people familiar to Gantt charts and computer programs. As the functionality of the PERT can be incorporated into this style of network perhaps we should not get to pedantic about where various functionality originated and just use whatever is best for the project and the users.
We will use Example 12.2 from 'Quantitative Methods in Business' to introduce the reader to the two 'styles' of network discussed above.
![]()