
[ WAA Home | ProjeX Home | Download ProjeX | Help using ProjeX | ProjeX FAQ | About WAA]
PERT analysis in ProjeX
Once the dependencies between tasks in a project have been set up and we have defined the range of estimated durations for each of the tasks we can calculate the expected durations and generate plots showing the project's critical path.
There are two basic ways of viewing the critical path on the Gantt chart, these can be set from the 'Plotting Parameters' dialog.
Want to know more about critical paths?
If the expected durations required for the PERT calculations have not been set for any of the tasks the following dialog will appear:
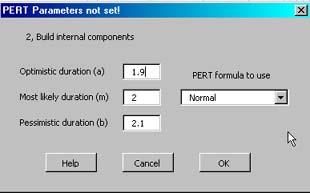
Please note ProjeX creates a new sheet on which to perform PERT, this is because the tasks have to be defined as start and duration (and not for example start and end) and also the task duration is set by the PERT result.
The critical path is then generated based on the PERT durations.
Set basic plotting style of the Critical Path on the Gantt chart
The calculated critical path can be displayed as colored bars on the Gantt chart and/or by changing the background of the cells containing the descriptions of the critical tasks..
Color critical Gantt bars
The Gantt bar of each task that is critical is colored red, non-critical tasks are colored light blue.
Color critical tasks
For each critical task, the background of the description cell is colored red.