

[ WAA Home | ProjeX Home | Download ProjeX | Help using ProjeX | ProjeX FAQ | About WAA]
![]()
We now have a basic ProjeX sheet, some tasks and milestones but it would be nice to understand in more detail how a task is changed and what links everything together.
For Task1 if we select Cell G12 we can change the duration from 4days to 5, when we hit enter the ending date of the task increases by one.
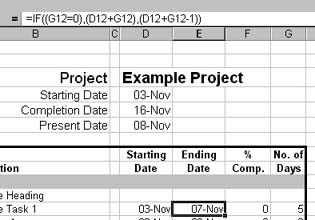
This is because ProjeX sets an Excel formula for the ending date so it is the starting date plus the duration. You will also notice that the start and end dates for all the other tasks are updated.
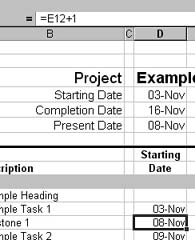
This is because ProjeX has set the start date of the other tasks and milestone to be dependent on the end dates of the previous tasks. This can be set manually by the user or automatically by ProjeX.
We still have not generated a Gantt chart. To do this we need to select the required option from the menubar.
We can also generate the Gantt chart in a new Excel sheet or as an Excel chart. Most of ProjeX's advanced display options are not available for the Excel chart option.
This gives us:
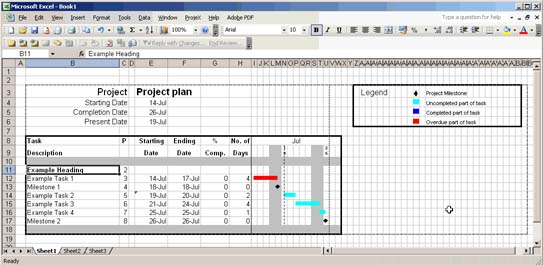
The overdue part of a task is colored red, completed parts dark blue and uncompleted parts light blue.
![]()