
[ WAA Home | ProjeX Home | Download ProjeX | Help using ProjeX | ProjeX FAQ | About WAA]
![]()
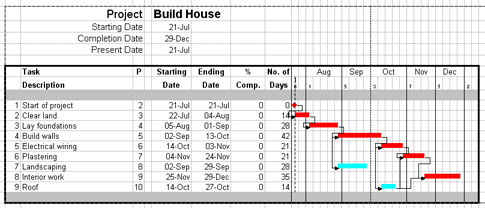
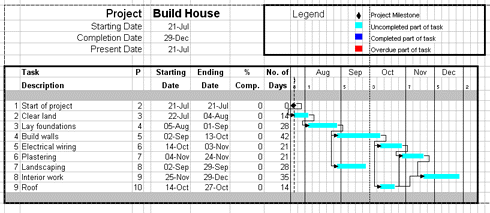
House Example - Critical Path Analysis
Now that we have defined the tasks and set their dependencies it can often be useful to find and show which tasks are critical (more info ...).
The critical path plot is generated using the option from the main ProjeX toolbar menu:
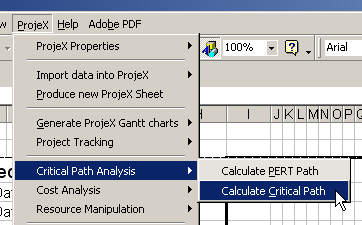
This brings up the following dialog:
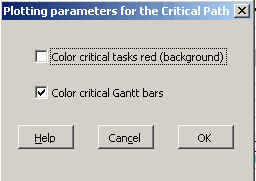
The first checkbox, if selected will color the task description cells of critical tasks red, the default option generates a Gantt chart with critical tasks colored red, non-critical light blue as below.