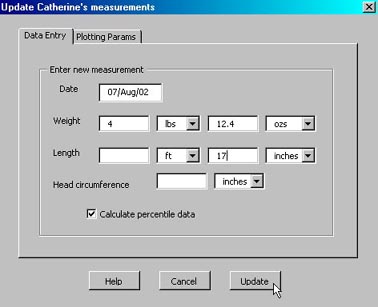
Each time BabeX is run with the baby's workbook, the user is asked to enter the date (for the first point this will be the date of birth) of the measurement, the baby's weight, length, and head circumference. If a particular reading (eg. head circumference) was not measured then just leave it blank.
The units (eg. lbs or kgs) that the data is recorded is specified by selecting from the pulldown tab. The 'Calculate percentile data' option updates the baby's table with the percentile (using US National Center of Health Statistics data) for that measurement. This can be annotated on the plot that is generated after entering data. No plots are produced when the birth data information is entered but always for subsequent updates.
There is now also the option to simply recalculate the percentile (say you entered the date or measurements incorrectly) or plot the chart without including the number of weeks the baby was born prematurely (or late).
The are four different plots that BabeX can produce (deselect all options and none are generated)
Weight vs. Age
Length vs. Age
Head circumference vs. Age
Weight vs. Length
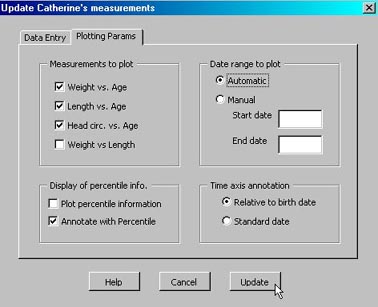
The time scale used for the Age axis can be specified as relative to the birth date (in weeks) or the absolute date is displayed. The measured data points can be annotated with the calculated percentiles and also trend lines for a range of percentiles can be displayed so the baby's progress can be compared with others.