[ WAA Home | ProjeX Home | Download ProjeX | Help using ProjeX | ProjeX FAQ | About WAA]
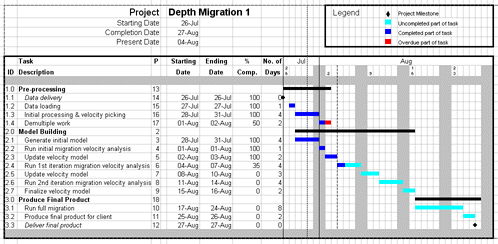
Once the project begins we need to track it's progress. If tasks are behind schedule then the amount they are behind appears in red, if part of a task is completed it appears as dark blue. The current date appears as a dashed line on the chart.
There are also a few other display options we can use to improve the 'look' of our chart. We can indent tasks and milestones relative to their group titles and also generate a task index to the left of the task descriptions using the 'Annotation' tab of the 'Display Properties' dialog. This gives us:

As the project progresses the user inputs the percentage each task is completed (actually a number between 0 and 100 rather than an Excel formatted percentage 0.0 - 1.0). The Gantt chart can then be regenerated, either on the same sheet or as a Gantt chart on a new sheet to keep a record of progress.
This is how ProjeX can quickly and easily be used to generate a Gantt chart for a proposal and then track its progress. However we have not actually set any dependencies between tasks, only manually via Excel between their starting and ending dates.
Let's look at how to set dependencies ...
