[ WAA Home | ProjeX Home | Download ProjeX | Help using ProjeX | ProjeX FAQ | About WAA]
Defining task durations by months not days
ProjeX task durations are usually defined in days, I want to define them in whole months and have the starting and ending dates formatted at mmm-yy?
From version 97.0.10.20 on ProjeX includes a Worksheet function that can be used (with some simple worksheet manipulation to generate this.
Step 1 : Add three extra columns to the ProjeX sheet using the Pad option under Display Properties. Expand out the columns that have been added and copy the Start/End and No. Days titles over. As the third column is now going to be the number of months rather than days we can change that to get:
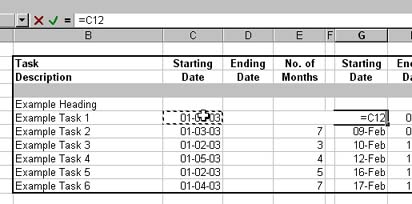
Step 2 : Lets add the starting dates for each of the tasks and their durations (in months). We can then set the (original) ProjeX start dates to be linked to our new starting date. We can repeat what is show below for each of the start dates.
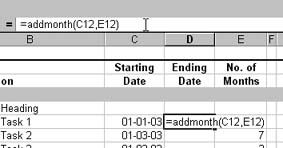
Step 3 : We now need to calculate our ending month based on the start and duration (in months). We use the command Addmonth(start date, No. of months). Select the end date cell and type =addmonth( and then click on the start date cell type in a , and then click on the duration in months and close the brackets. This gives us:
Step 4 : Again we can drag this formula down to set the rest of the end dates. We can change the format of the date cells from the menubar Format | Cells and setting the date format to mmm-yy. We also need to set the number of days to be equal to our end month (date)- start month (date) + 1. Again this can be dragged down to set the other durations.
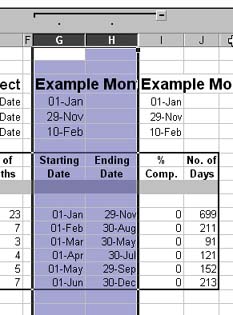
Step 5 : We can now group the starting and ending (day) dates so they can be hidden - we also need to copy the project title and dates to other cells so they will be visible when we hide the day dates.
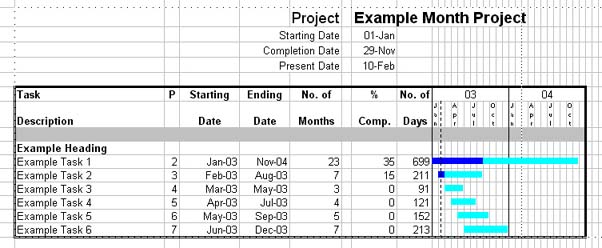
Step 6 : We can now plot our Gantt chart in the normal way, updating the monthly start and duration columns and the % completion as usual.


