[ WAA Home | ProjeX Home | Download ProjeX | Help using ProjeX | ProjeX FAQ | About WAA]
General options of the Display Dialog

 |
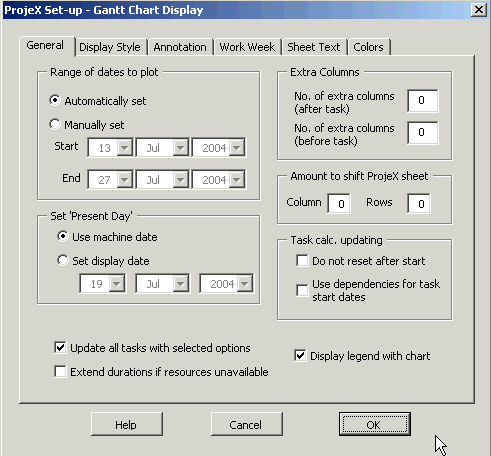
The range of dates plotted in the Gantt chart can either be automatically calculated by ProjeX (using all the defined tasks) - default, or user specified. This is of use if a project is spread over many months or years. |
 |
The date used by ProjeX when generating the Gantt charts can either be defaulted to the PC's date or the user can specify a date to 'use' as the present day when generating Gantts. Tasks will be colored overdue or on track based on the user specified value. |
| A number of options relating to tasks and how they are displayed can be set on a task by task basis using the 'Task definition' option. If you want all tasks to be updated with the options set by this dialog (eg. the way weekends are used) click the box. | |
 |
ProjeX automatically defines tasks as either start and duration or start and end. If the user then wants to change the way task durations or ends are calculated then this option needs to be selected otherwise ProjeX will overwrite with the formula defined when the sheet was created. |
 |
If set, ProjeX will update the formula for the starting date of a task if it is set to be dependent on another task. This will be the default setting when setting dependencies. The user is asked (prior to regenerating the Gantt chart) if all the formula should be overwritten prior to plotting. If in doubt save the sheet first. |
 |
This option has moved to the Display tab. |
 |
Defines the number of extra columns can be added between the task description and the blank column before the date parameters. |
| The Gantt chart can be displayed with or without the Legend box, this option turns it off. | |
 |
This option has moved to the Annotation tab. |
