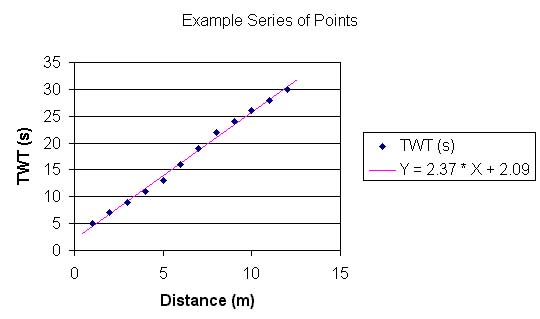
After calculating the regression parameters for the supplied x,y points TrendeX draws a line on the Excel chart using the parameters and then labels it. This option defines the text used to label the equation
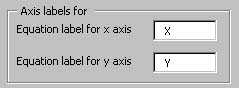 |
If the labels are left to default as x and y then
the annotation will appear as:
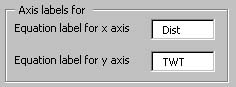
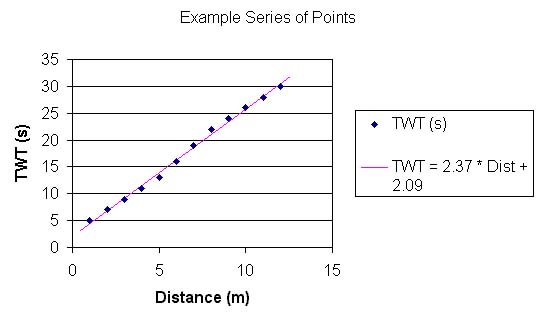
However if we change the labeling options to:
Then the equation is labeled as
|