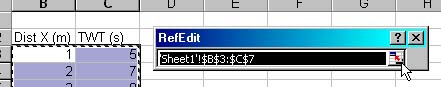
The user needs to specify the range of cells (containing the x,y pairs) in the spreadsheet for TrendeX to work on.
| The user can select data ranges before calling
the dialog or after by minimizing the dialog using
the '=' button to the right of the field showing the
range of data selected.
Having selected the data range to analyze clicking on the little sheet icon maximizes the dialog again.
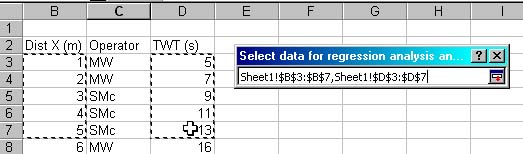
The data to plot to not need to be in adjacent columns using the Ctrl key and the left mouse button a second column can be selected that is not adjacent.
|
|
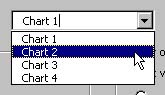
| Once the regression analysis has been completed
the regression curve is plotted on a user specified
chart. The user can select any chart existing in the
workbook from the pulldown menu.
|