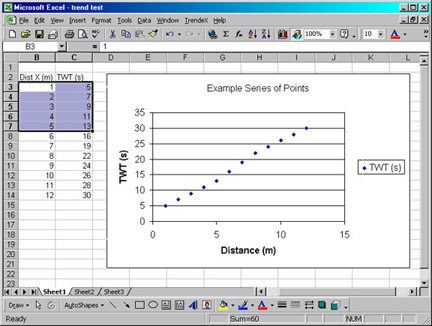
1. The workbook must already contain a chart that will have the trend line drawn on.
2. Select the data point pairs you want to use for the calculation (this can be done after starting TrendeX).

3. Select the 'Add trend line to chart' option from the TrendeX menu.
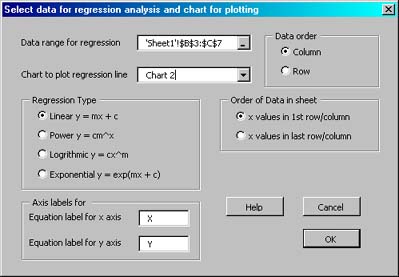
4. The following dialog box will appear, select the chart you want to plot the trend line on and click 'OK'

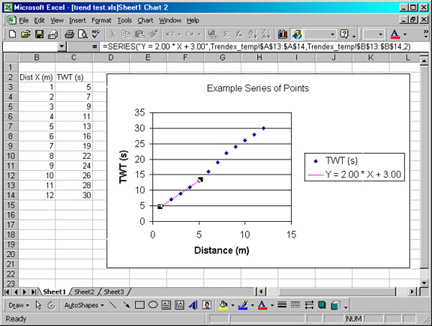
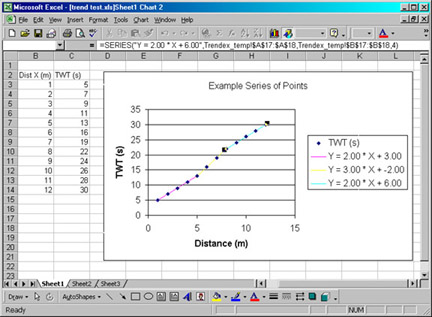
5. The trend line is then plotted on the chart, and the regression parameters are detailed in the chart legend.

6. A different set of data points can then be selected and steps 3-5 repeated as required.
