[ WAA Home | ProjeX Home | Download ProjeX | Help using ProjeX | ProjeX FAQ | About WAA]


<< Previous page

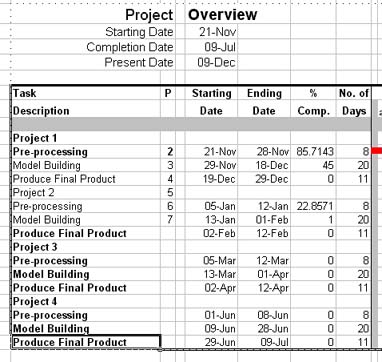
Having repeated the right mouse but option to select the tasks ranges from each of the projects for each of the overview tasks we get:


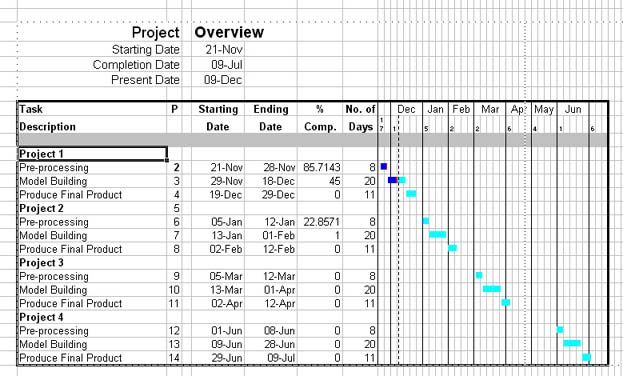
We can now generate a Gantt chart (the plot below is with the weekly time axis).

We can take this one step further and group our new overview tasks.

Next page >>

Go back to top


Copyright Mike Witcombe of WAA, 1996-2003.
Please review our privacy policy.
For problems or questions regarding this web site contact [products@waa-inc.com].