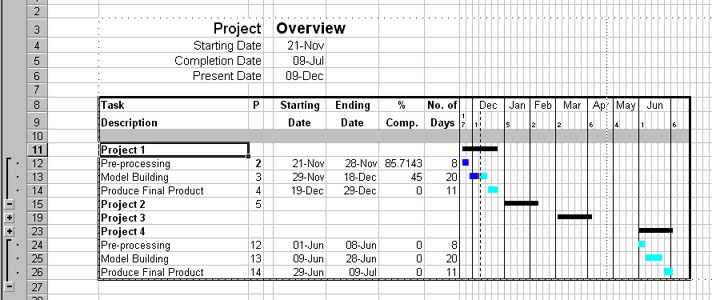
By selecting the 'Plot group info.' option of the 'Display Options' dialog when ProjeX finds a group of tasks a bar is draw on the Gantt chart in the row of the group heading showing the total duration of the group of tasks.
At the same time the group of tasks are 'grouped'
together in the Excel sense (a little ![]() icon appears
on the left of the sheet) allowing the group to easily be
compressed to just show the group heading and the overall extent
of the group (in the image above Projects 2 and 3 have been
compressed).
icon appears
on the left of the sheet) allowing the group to easily be
compressed to just show the group heading and the overall extent
of the group (in the image above Projects 2 and 3 have been
compressed).
The group can be expanded back out by clicking on the ![]() icon on the
left of the sheet.
icon on the
left of the sheet.
The color used for this bar is the same as that specified for the milestone. This option is not available in the freeware version of ProjeX.
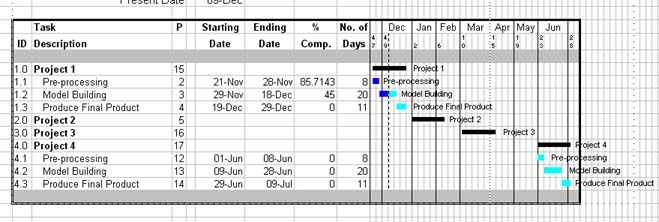
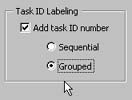
We can refine the appearance further by indexing the groups and their tasks using the 'Task ID' option from the 'Annotation' tab of the 'Display Properties' dialog
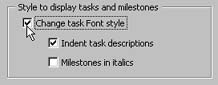
and also by indenting the tasks relative to the group titles using the Style option.
As a final touch lets also plot the task/group titles to the right of each Gantt bar on the chart using the annotation option.
Now when we regenerate the Gantt chart we get